The situation with Iran appears to be stabilizing, as evidenced by the drop in oil prices; and since, as we know, oil and gold have been moving in opposite directions in recent months, the obvious next scenario is a rise in the price of gold.
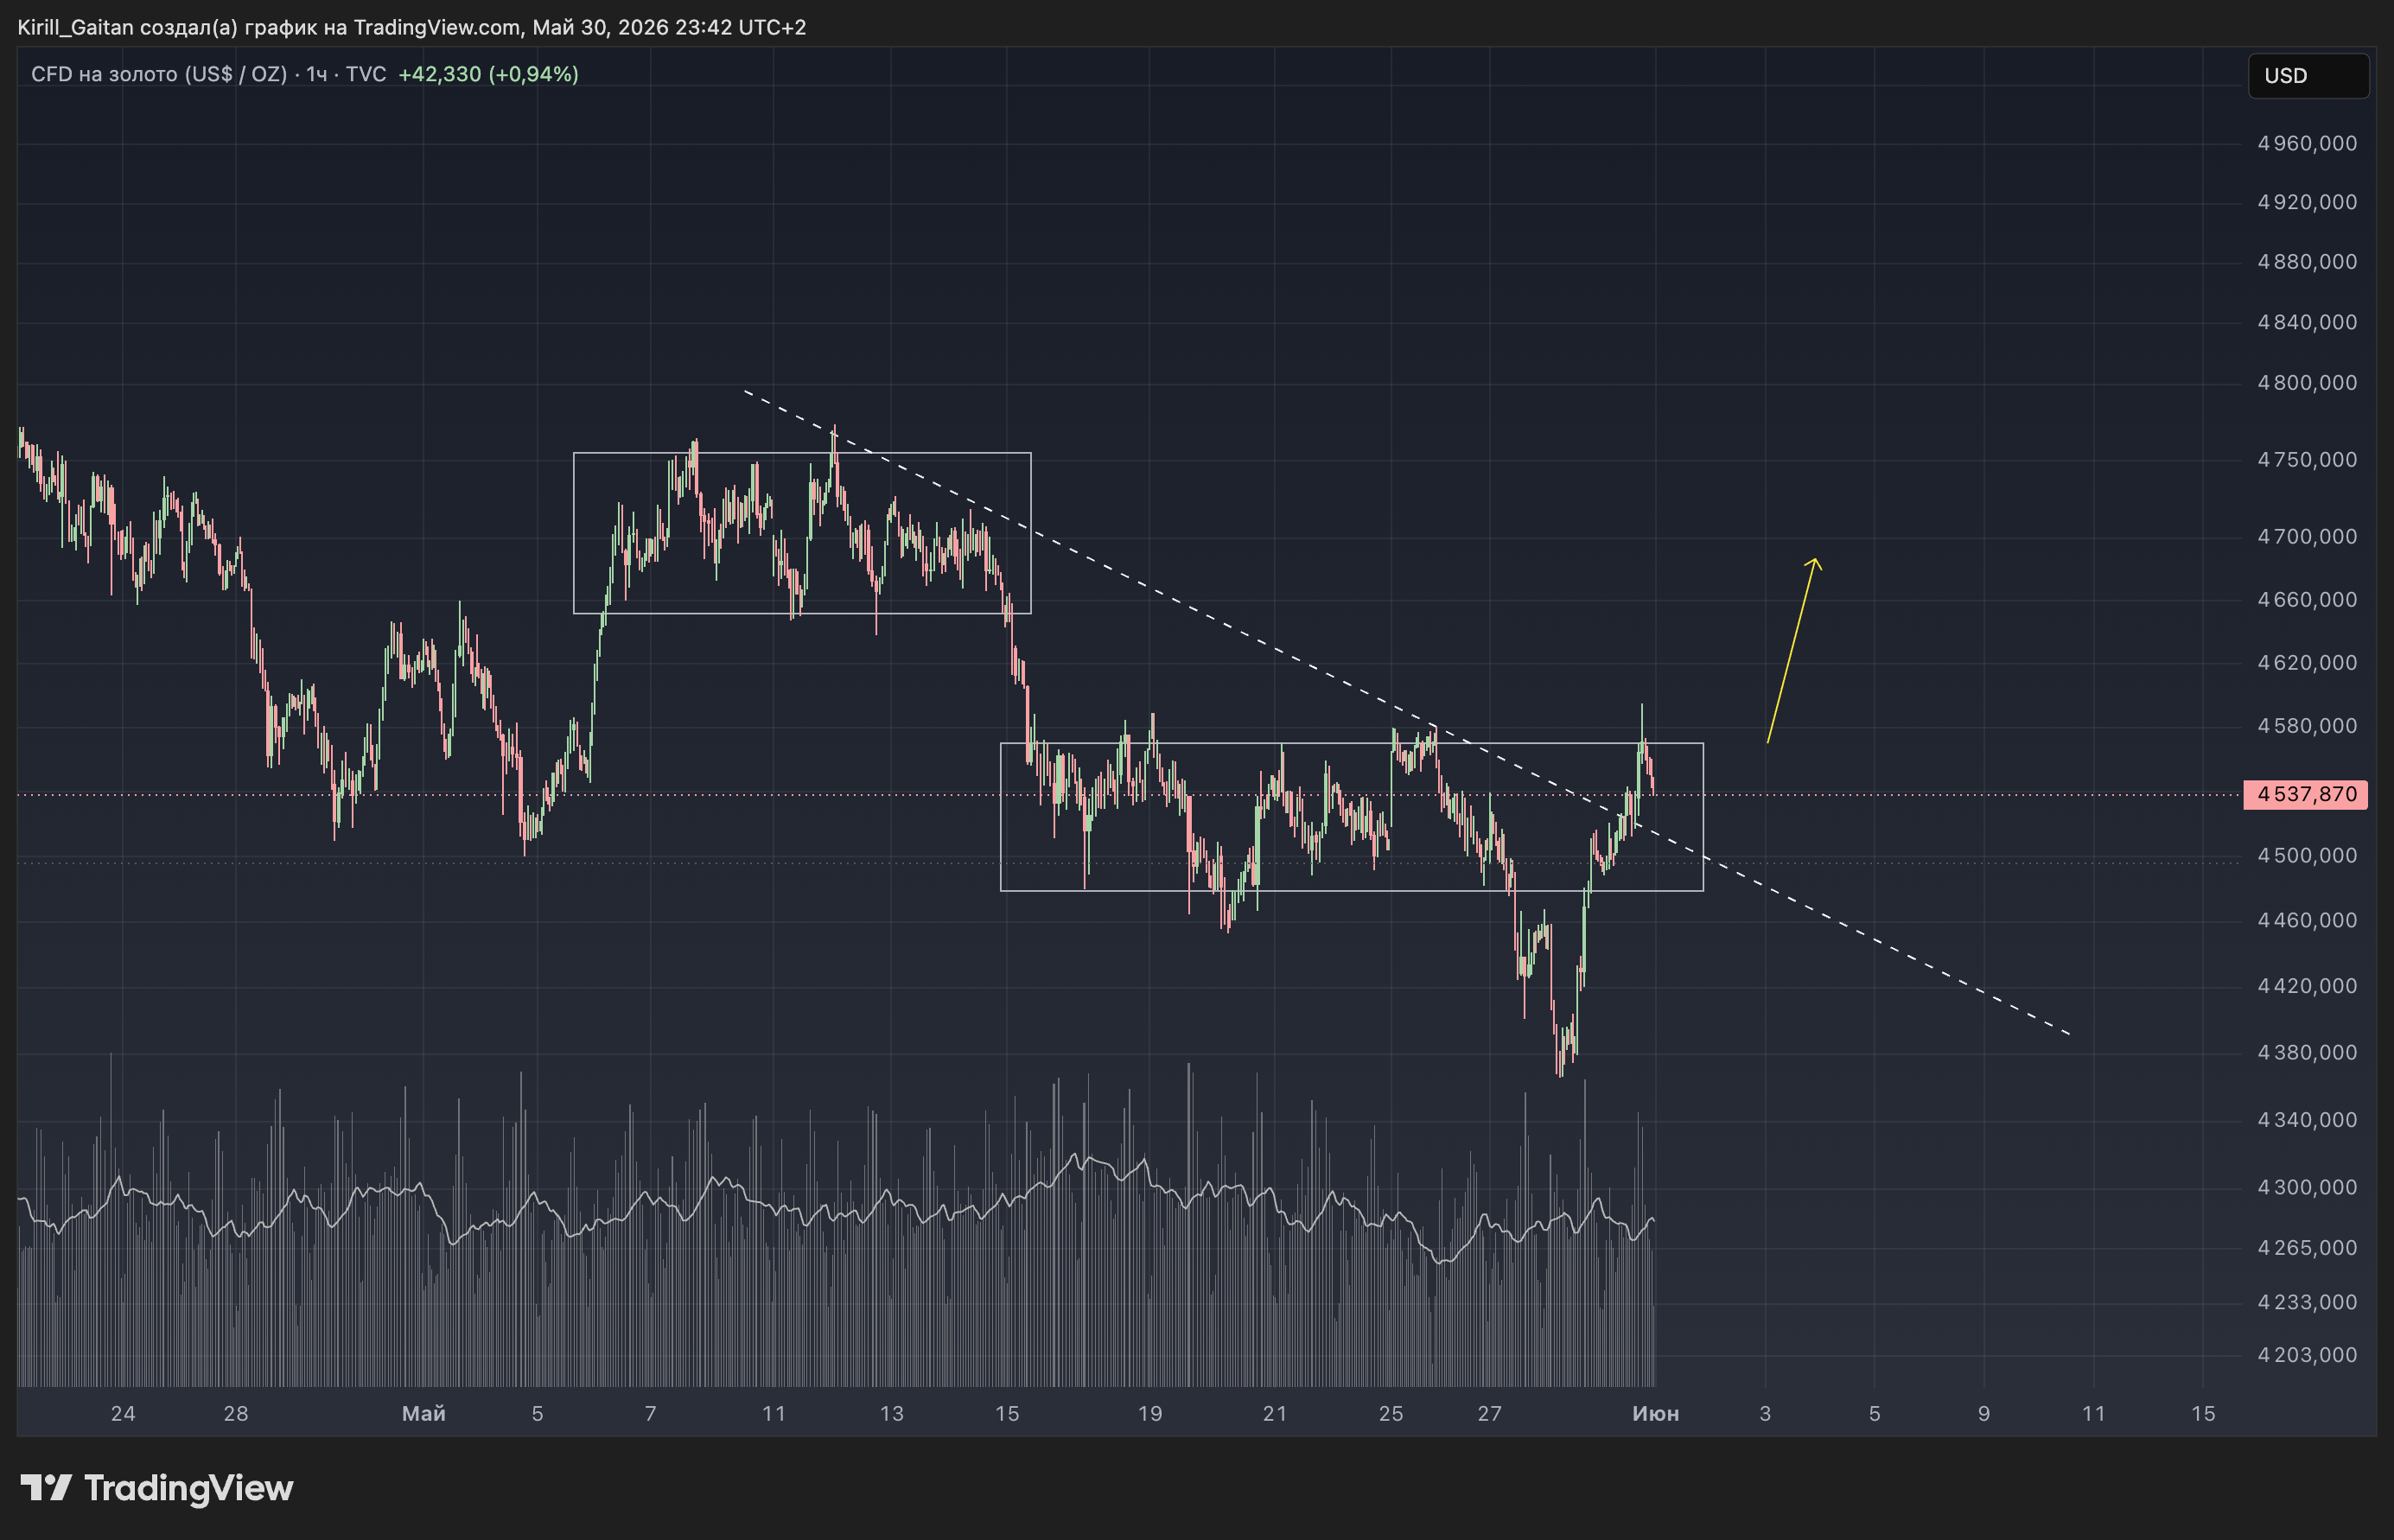
In addition, gold has now formed a solid base for growth on the chart; some may see an inverted H&S pattern here, but whatever you call it, we need to watch for a breakout from the consolidation and a breach of the 4600 zone.
We should filter the breakout in gold using the GDX ETF, which tracks gold mining companies. Typically, this ETF outperforms the underlying asset, and a move above $90 would mark a local break of the downtrend, invalidating the scenario below $77.
Seasonal factor: According to statistics from the past 20 years, the gold market in June has been fairly weak, showing a 42% gain, while July is one of the strongest months of the year with a 63% positive return. However, this year, seasonality is unlikely to play a significant role.
DYOR.
analysis.typeBadges.anomalyGOLD
Gold Prices Set to Surge: Analyzing Recent Market Trends and Patterns
The gold market is regaining interest.
BYKIRILLMay 30, 20261 MIN READ5 VIEWS
TAGS
#gold-prices#GDX-ETF#gold-market-trends#oil-prices#gold-trading-patterns#how-to-trade-gold#gold-market-seasonality#impact-of-oil-on-gold-prices